YouTube Transcription Corpus Building Tool
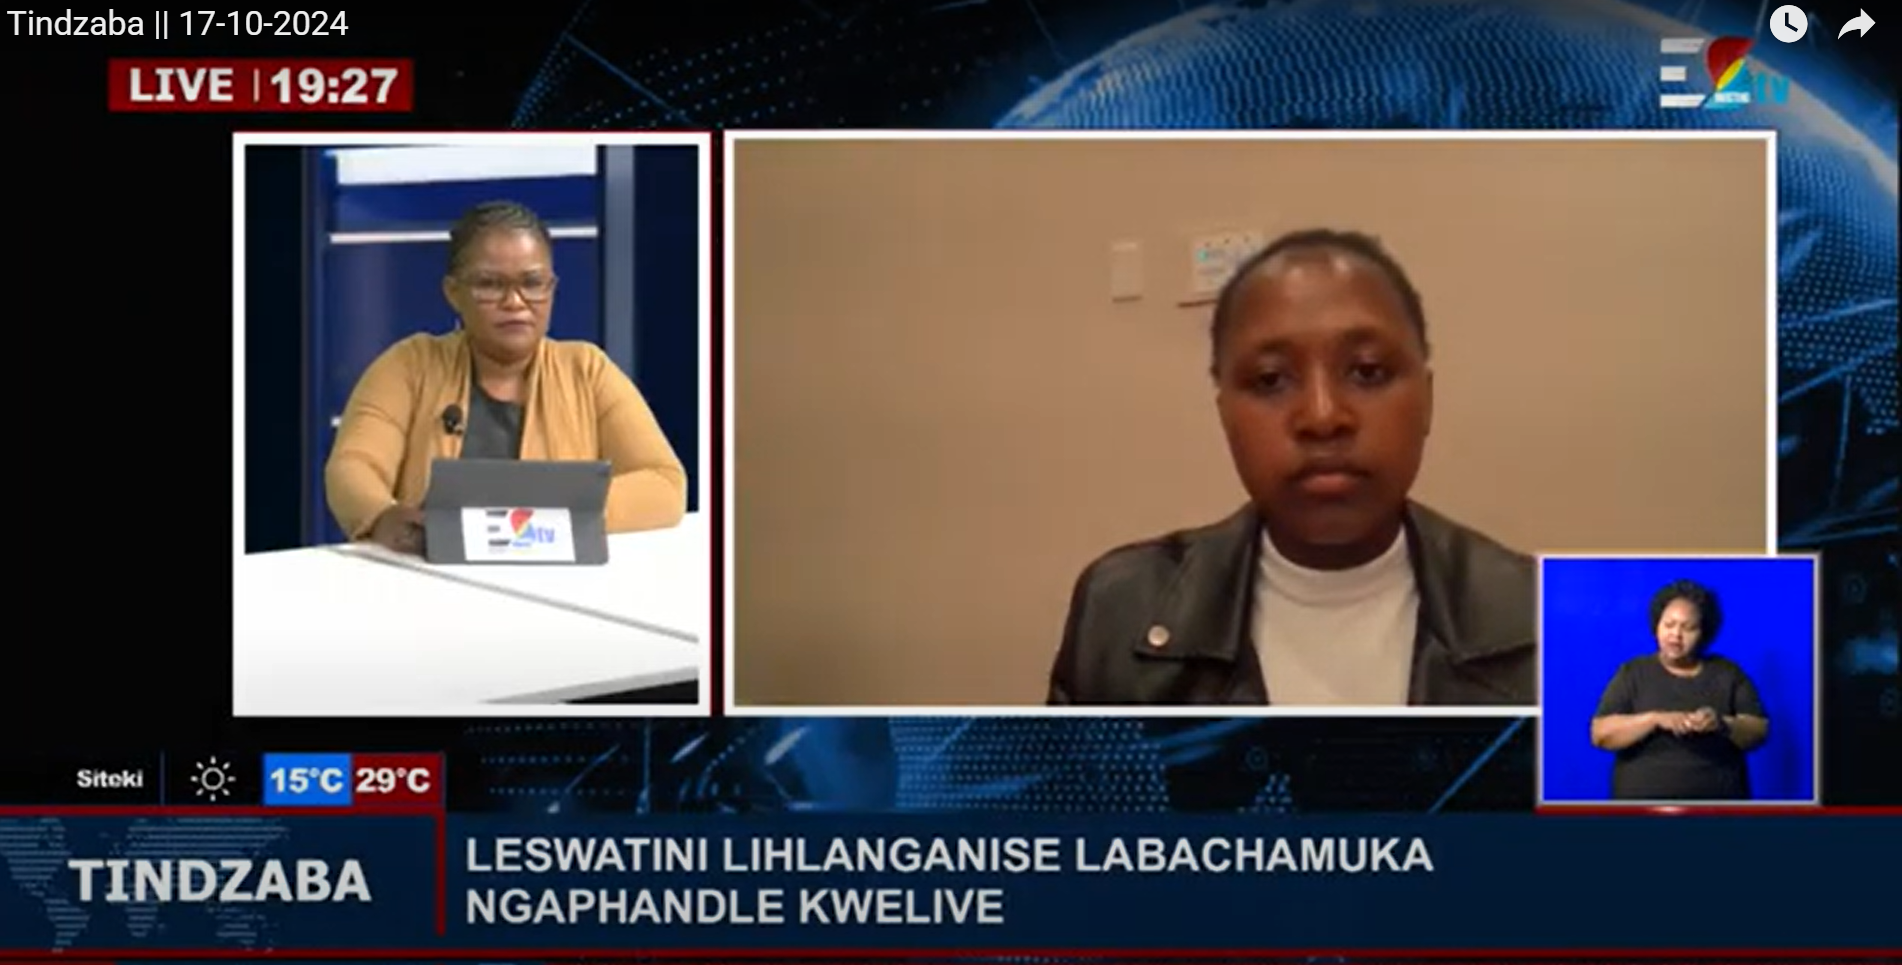
Eswatini TV Broadcast
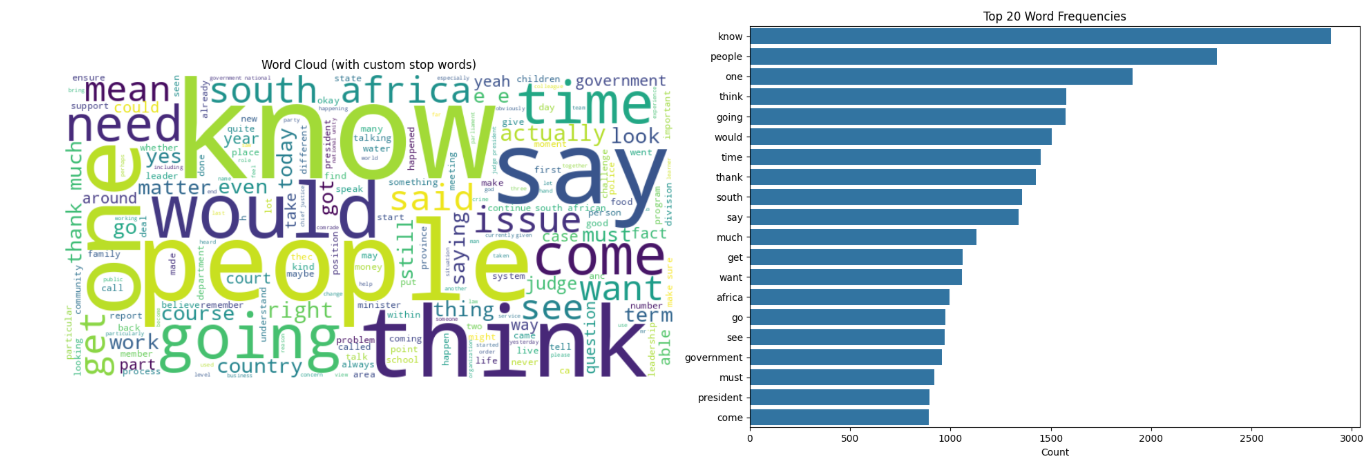
Word Cloud and Top Word Frequencies
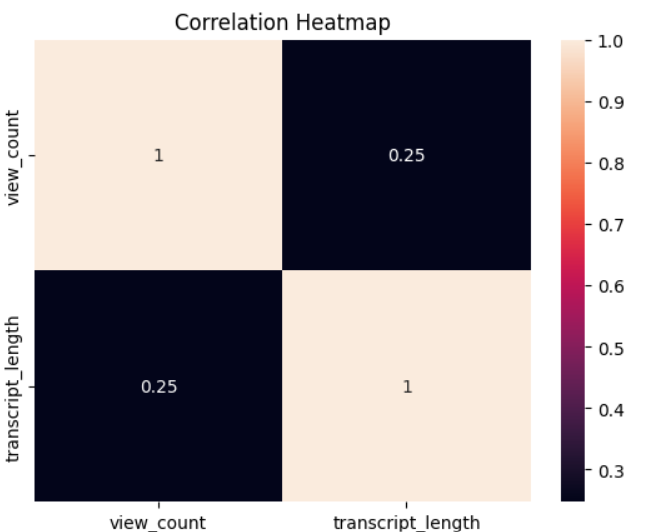
Correlation Heatmap
Project Overview
Developed for the DHASA Hackathon for the Southern African Development Community (SADC) region, this robust tool extracts, processes, and analyzes YouTube video transcripts to build a comprehensive text corpus for natural language processing (NLP) tasks. The hackathon, aimed at advancing digital media research in Southern Africa, encouraged the development of tools to analyze social media, mobile media, and news content. This project gained significant recognition, being featured in Eswatini TV news broadcasts (News Broadcast 1, News Broadcast 2).
The tool leverages the YouTube Data API v3 to collect video metadata (e.g., video ID, title, upload date, view count) by querying a channel’s upload playlist with pagination handling for extensive data retrieval. It supports multilingual transcripts, prioritizing languages relevant to the SADC region (English, isiZulu, SiSwati, isiXhosa) alongside Spanish, using the youtube-transcript-api. An interactive dashboard, built with Next.js and Recharts, visualizes insights like word clouds, sentiment distributions, and topic trends, enabling researchers to perform comparative media analysis and content categorization for digital humanities research in the SADC region.
View Frontend Code View Backend CodeMultilingual Transcript Extraction
Extracts YouTube transcripts using the YouTube Data API v3 and youtube-transcript-api, supporting English, isiZulu, SiSwati, isiXhosa, and Spanish, with cleaning of non-speech elements like [Applause].
Advanced Text Preprocessing
Tokenizes, lowercases, and filters non-alphanumeric characters and stop words (NLTK and custom lists) to prepare transcripts for analysis.
N-Gram Frequency Analysis
Identifies top unigrams, bigrams, and trigrams using NLTK’s ngrams and Counter, visualized as word clouds and bar charts for key terms.
Dual Sentiment Analysis
Combines NLTK’s VADER for social media sentiment and TextBlob for polarity, displaying distributions in interactive pie charts.
Named Entity Recognition
Uses spaCy’s en_core_web_sm model to identify and categorize entities (e.g., people, organizations), shown in a table with counts.
Topic Modeling
Employs Gensim and scikit-learn’s LDA to extract 5 key topics with representative words, visualized in cards for content insights.
Predictive Modeling
Applies scikit-learn’s linear regression to predict video view counts based on transcript length, evaluated with Mean Squared Error.
Interactive Dashboard
Provides a responsive Next.js interface with Recharts visualizations (word clouds, bar charts, pie charts, tables) for real-time insights.